- Bitbo Charts
- Posts
- 🟠 New Bitbo Calculator
🟠 New Bitbo Calculator
Strategy backtest
Invest in and trade Bitcoin with data, not guesses

We’re offering 30% off all annual plans until May 29th with code ATH25:
📈 Unlock 35+ private charts - with more added weekly
⚡ Faster chart updates - go from 1 hour to 10 seconds
📝 Reports - monthly Bitcoin price analysis by Jordan, Bitbo’s CEO
🔔 Live alerts - on key indicators and charts
🎁 Private TradingView indicators - lifetime access for yearly plans
Bitbo is excited to announce our newest chart:

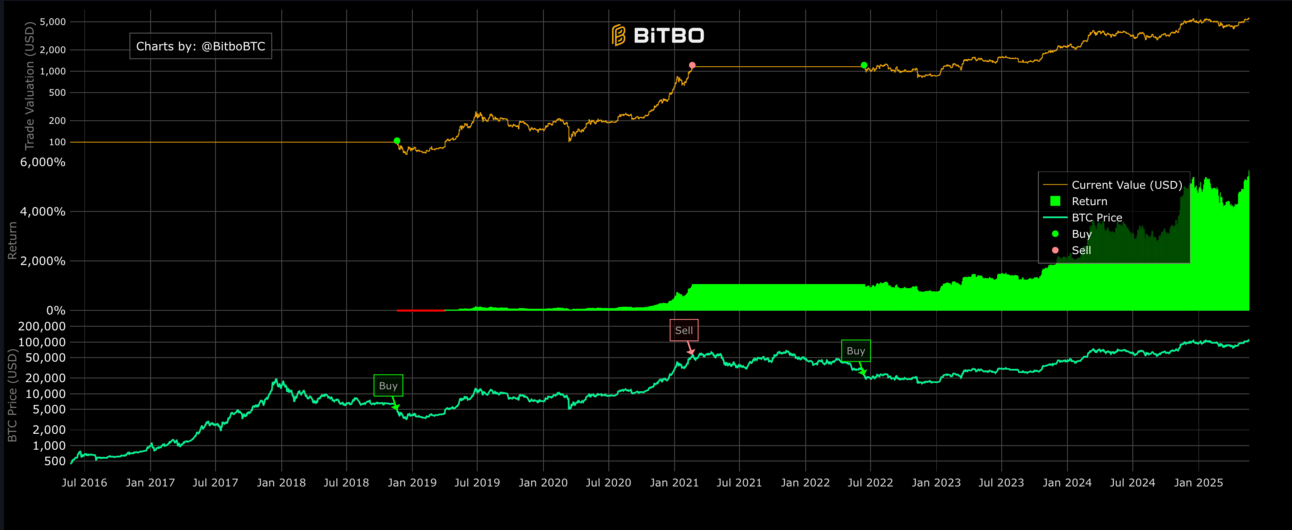
This calculator allows you to backtest Bitcoin trading strategies based on indicators.
After clicking calculate, the chart will display:
1. The green line shows Bitcoin's price movement during the backtest period.
2. The orange line represents your portfolio value in USD based on your strategy's trades.
4. Buy and sell signals are marked on the chart with annotations, showing when your strategy would have entered or exited positions.
5. The return percentage is displayed between the portfolio valuation and bitcoin price chart, with green indicating profit and red indicating loss.
