- Bitbo Charts
- Posts
- 🟠 New Bitbo Chart
February Sale — 40% Off Annual Plans
Bitbo is excited to announce our newest chart:

This chart visualizes the average percentage change in Bitcoin's price for each day of the week since a selected year.
NEW: Range Selector for Bitbo Pro Members
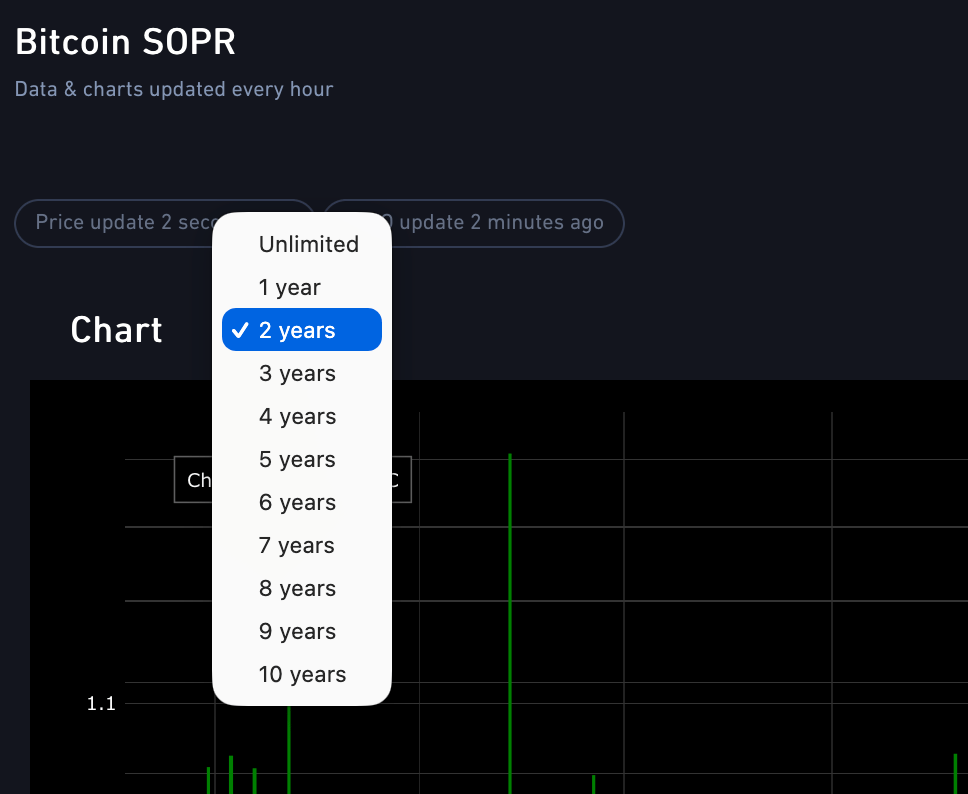
Bitbo Pro members can now adjust the default zoom of charts. Or, leave default zoom as the entire history but show the range selector. This gives a much nicer and clear view of the data.
