- Bitbo Charts
- Posts
- 🟠 New Bitbo Chart
Bitbo is excited to announce our newest chart:
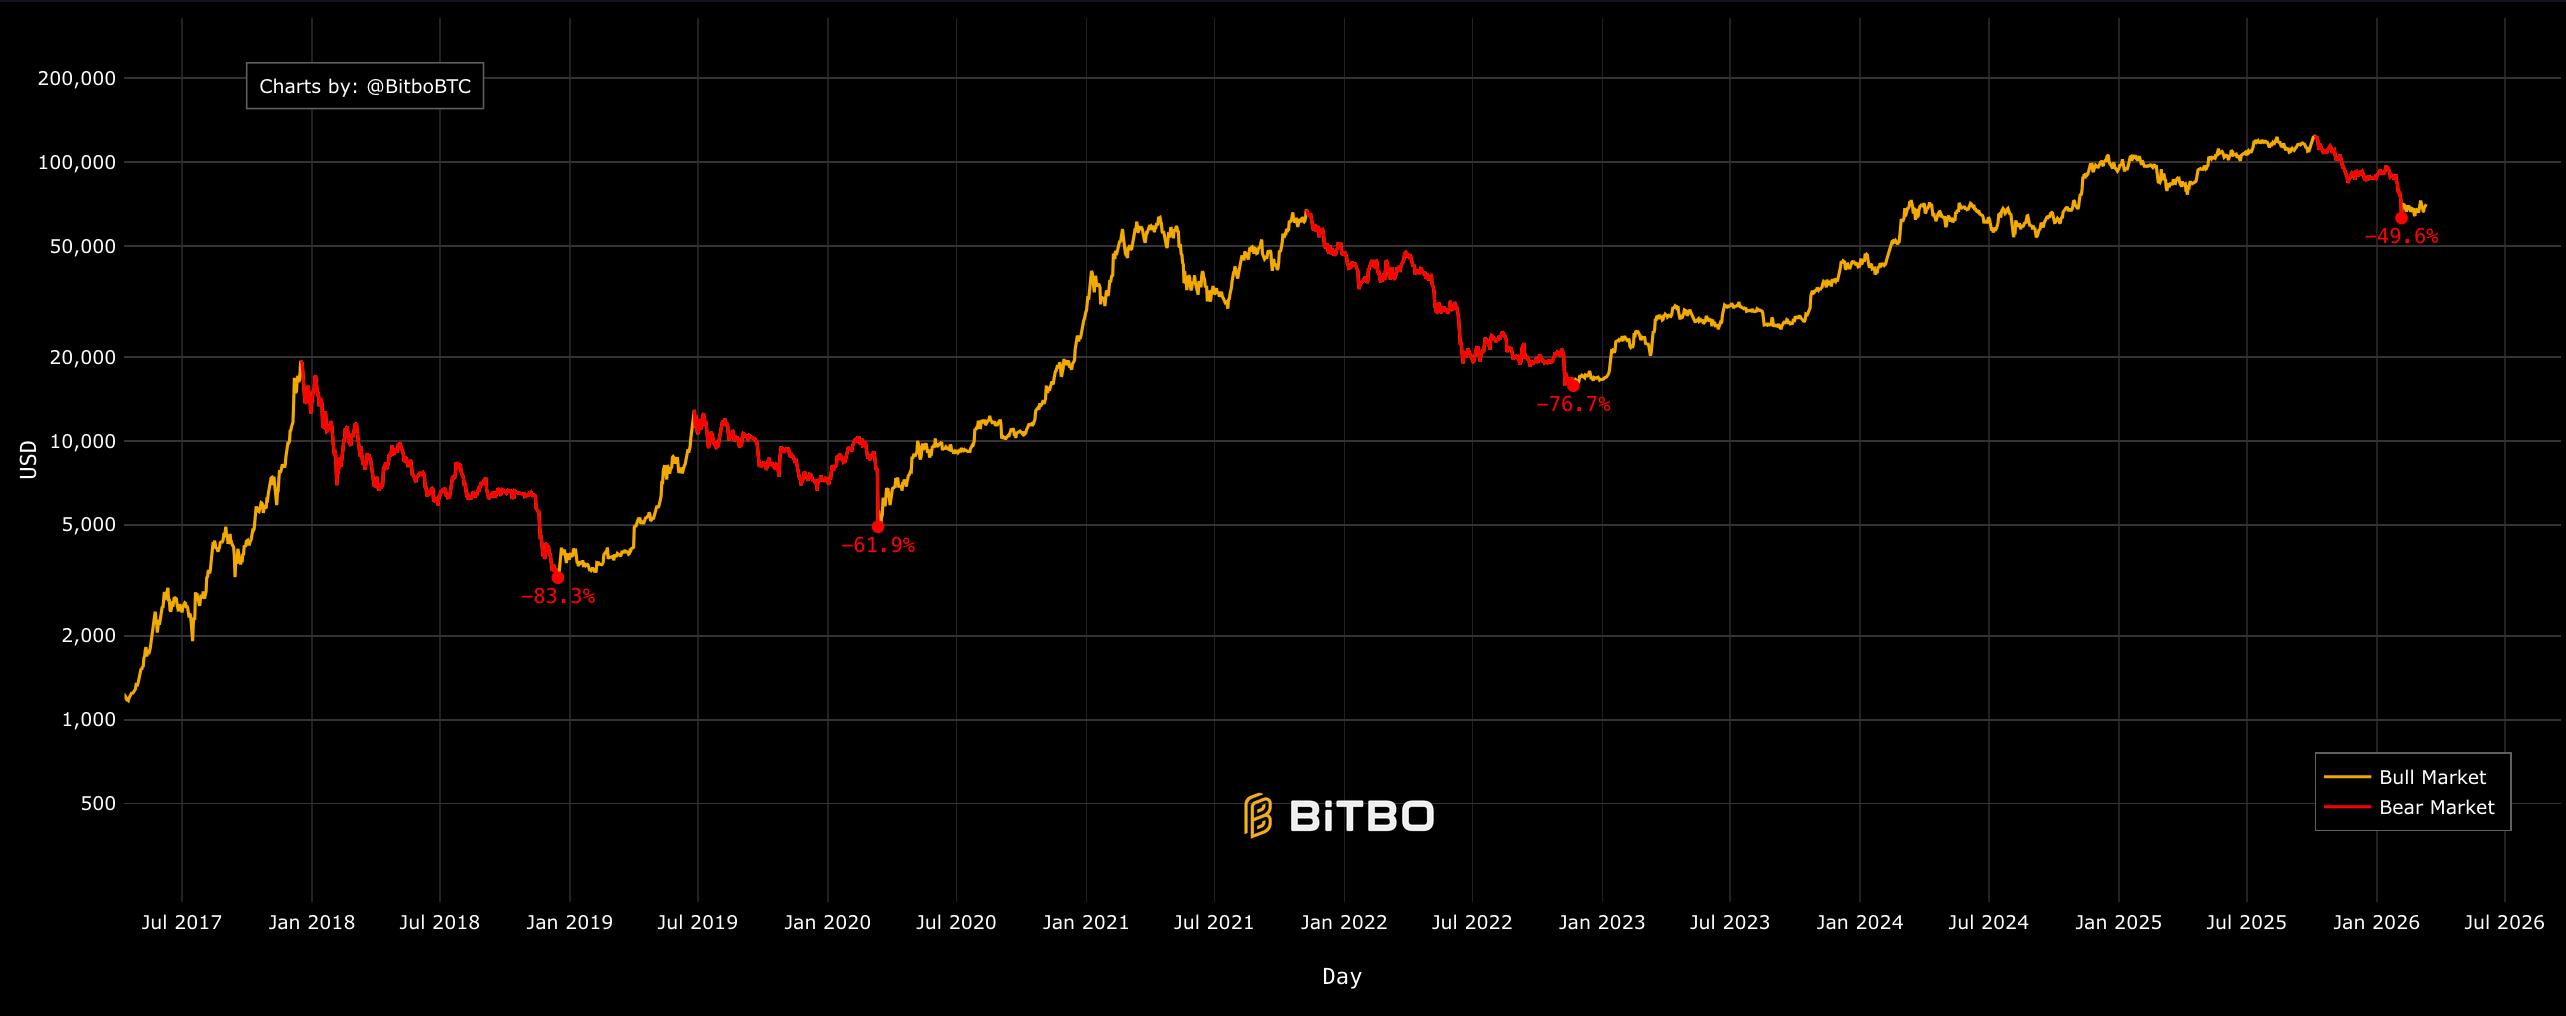
Bitcoin Bear Markets (red)
This chart visualizes Bitcoin market Cycle Transitions across historical time periods:
Bull Market (Orange): Price growth leading to a peak and the recovery following a bottom.
Bear Market (Red): The specific draw-down period between the Cycle High and the subsequent Cycle Low.
NEW: Range Selector for Bitbo Pro Members
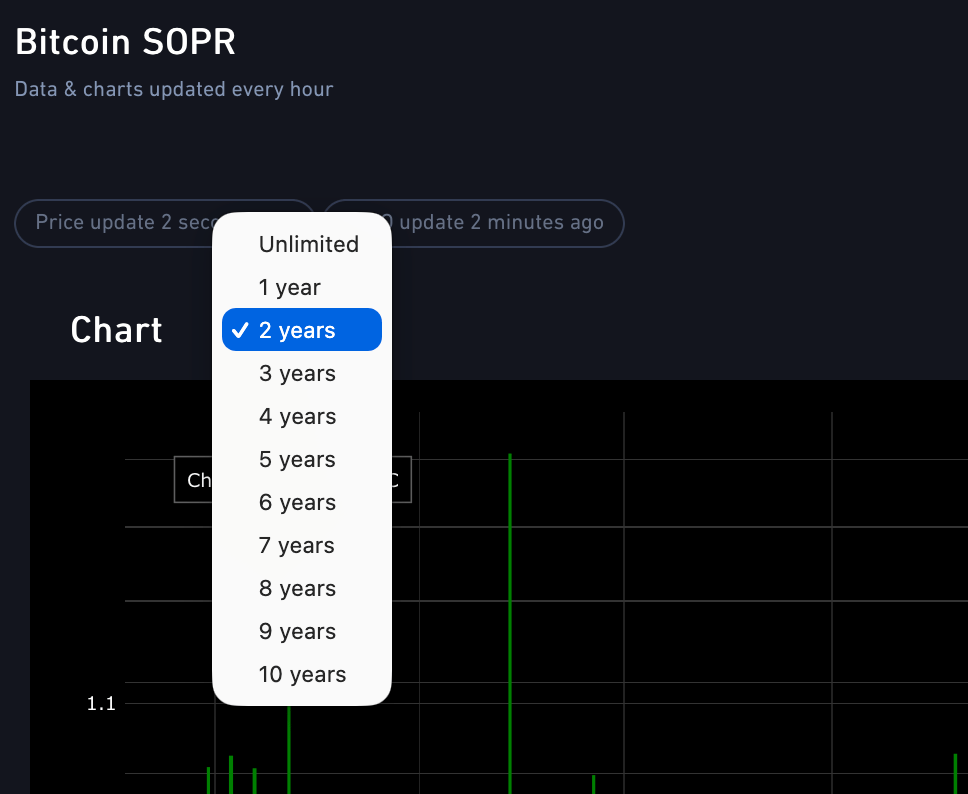
Bitbo Pro members can now adjust the default zoom of charts.
Or, leave default zoom as the entire history but show the range selector.
This gives a much more clear view of the data compared to zooming and scrolling.
