- Bitbo Charts
- Posts
- 🟠 New Bitbo Chart
Bitbo is excited to announce our newest Pro chart:
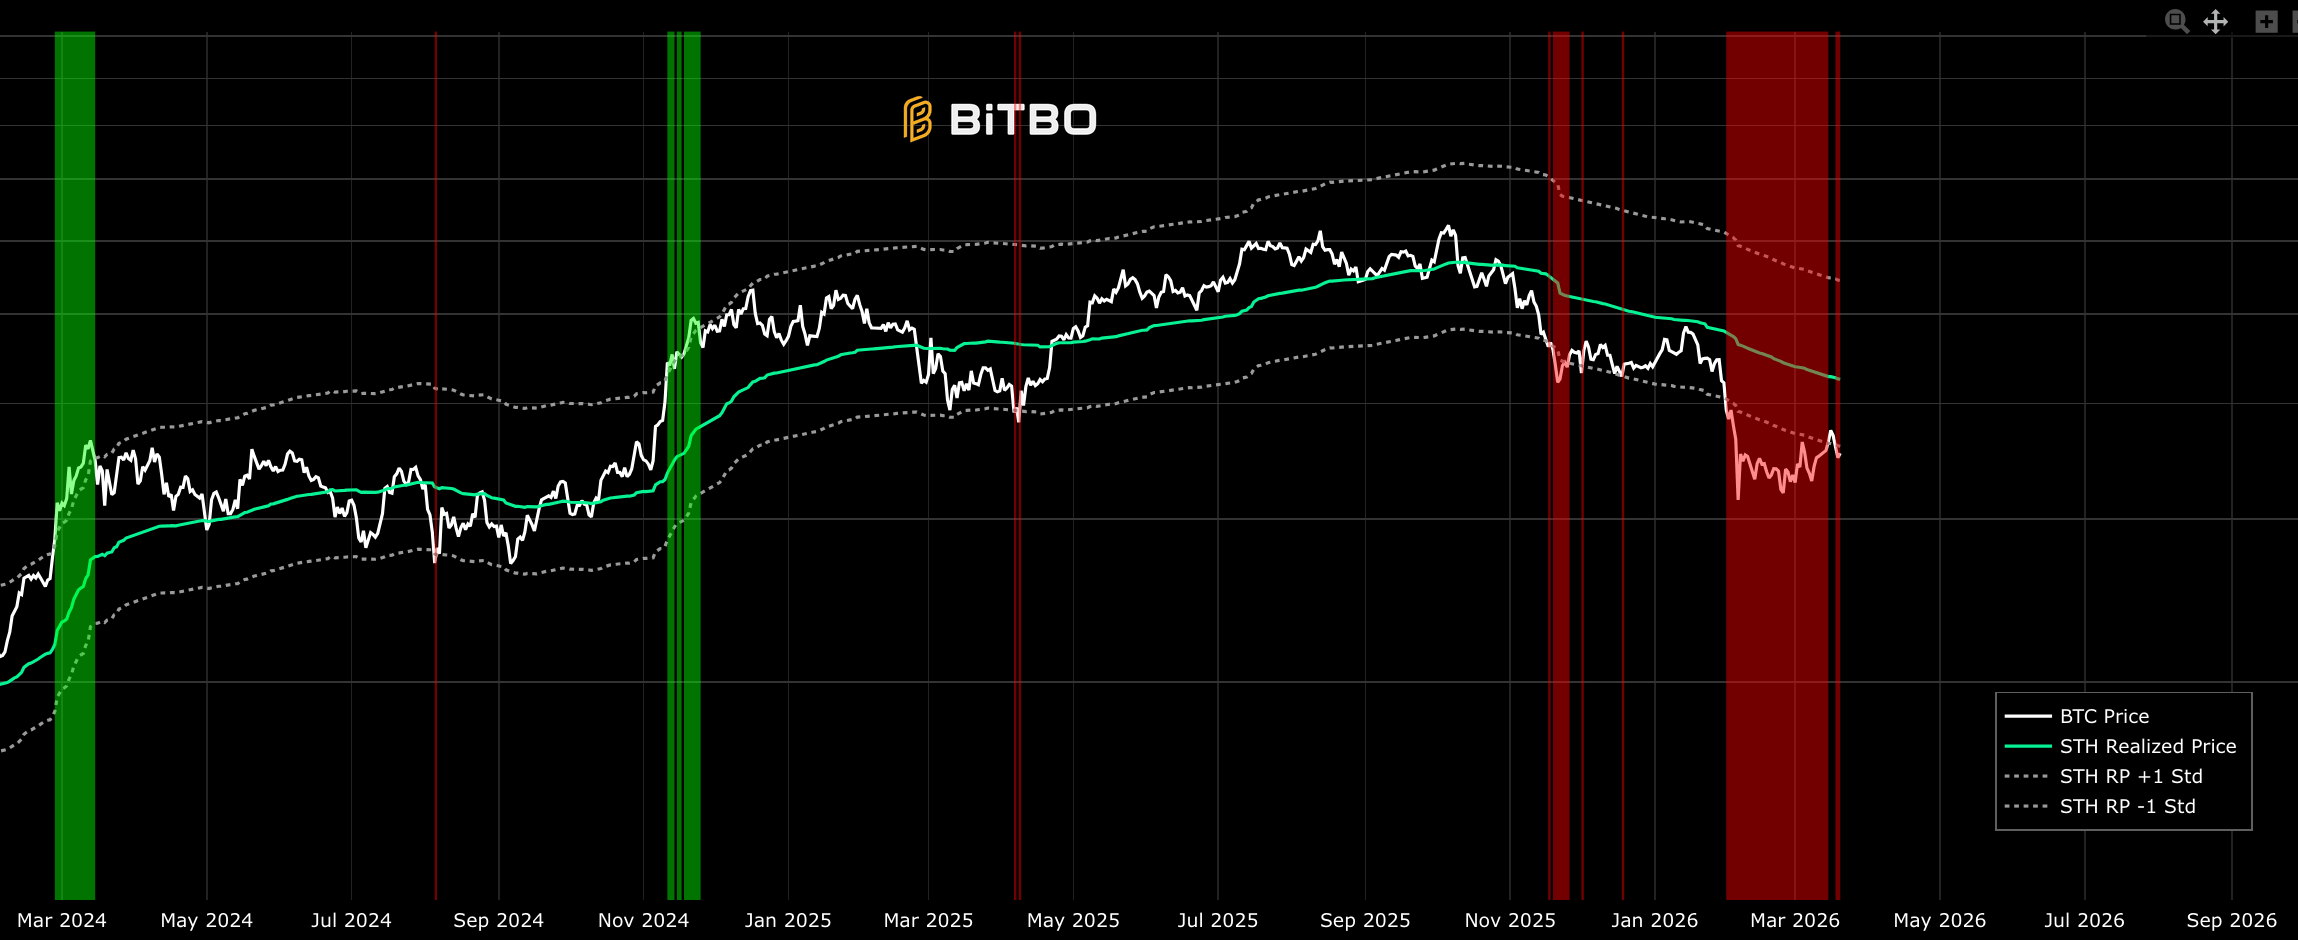
The green line is the STH Realized Price (avg cost basis of coins moved in last 155 days).
The dotted bands = STH RP × (mean MVRV ± 1 std).
Green background → price above upper band (overheated)
Red background → price below lower band (opportunity)
The "Calc" toggle switches whether mean/std are computed over full history or last 10 years.
NEW: Range Selector for Bitbo Pro Members
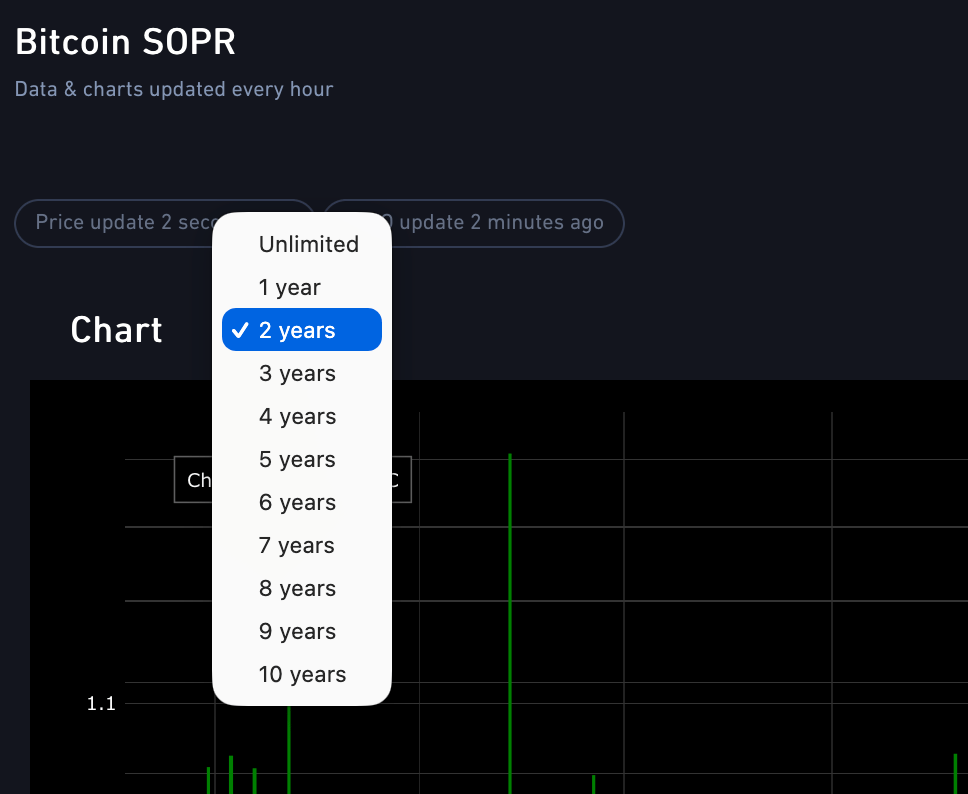
Bitbo Pro members can now adjust the default zoom of charts.
Or, leave default zoom as the entire history but show the range selector.
This gives a much more clear view of the data compared to zooming and scrolling.
